|
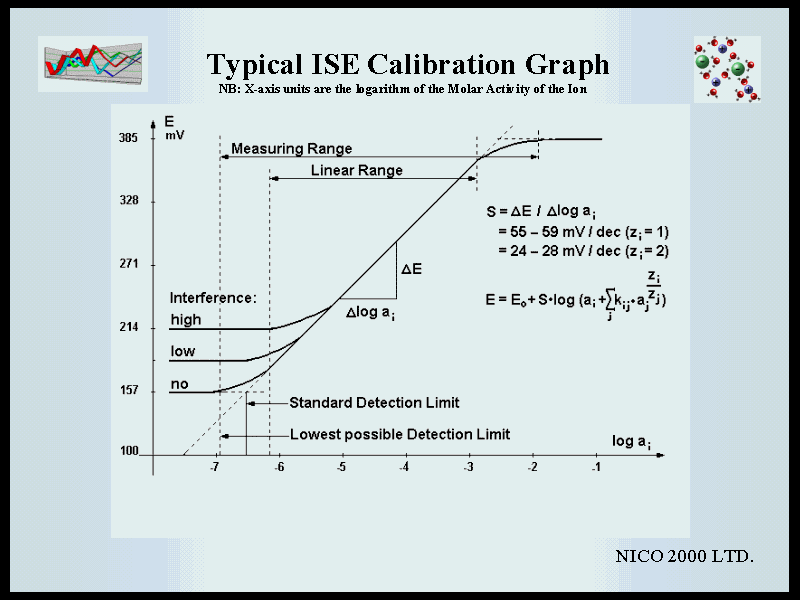
NEXT PAGE | PREVIOUS PAGE | BACK TO CONTENTS LIST | GO TO WWW.NICO2000.NET | Beginners Guide to ISE Measurement. Chapter 7. Calibration is carried out by immersing the electrodes in a series of solutions of known concentration and plotting a graph of the mV reading versus the log of the activity (or the actual activity on a logarithmic X-axis). This should give a straight line over the whole linear concentration range. However, as noted above, activity is difficult to determine in complex solutions and it is generally more useful to plot concentration units. In this case the effect of variable activity coefficients in solutions with high ionic strength can be minimized by adding Ionic Strength Adjustment Buffer to all standards and samples - but note the limitations to this detailed in the previous chapter. Nevertheless, it must be noted that if the samples to be measured are likely to have a total ionic strength of less than about 0.01M for monovalent ions (0.001M for divalent ions) then the activity effect should be insignificant and it may not be necessary to add ISAB. However, it must be noted that ISAB may be useful when using a double junction reference electrode with a non-equi-transferrent outer filling solution, in order to compensate for drift in the liquid junction potential, and in general most ISE systems give a stable reading more quickly in high ionic strength solutions. The slope of the calibration graph is the mV response per decade of concentration change. This is typically around 54 mV/decade for monovalent ions and 27 for divalent ions and will have a negative value for negative ions - i.e. a higher concentration means more negative ions in solution and therefore a lower voltage. a) Linear Range. The linear range of the electrode is defined as that part of the calibration curve through which a linear regression would demonstrate that the data points do not deviate from linearity by more than 2 mV. For many electrodes this range can extend from about 0.1 Molar down to 10-6 or even 10-7 Molar. b) Total Measuring Range. The total measuring range includes the linear part of the graph as shown below together with a lower curved portion where the response to varying concentration becomes progressively less as the concentration reduces. Samples can be measured in this lower range but it must be noted that more closely spaced calibration points are required in order to define the curve accurately and the percentage error per mV on the calculated concentration will be progressively higher as the slope reduces. c) Limit of Detection. For monovalent ions, the IUPAC definition is: that concentration at which the measured potential differs from that predicted by the linear regression by more than 18 mV. The practical limit of detection can be calculated by plotting a calibration graph using several standards at the lower end of the concentration range, and below it. Say 100, 10, 1, 0.1, 0.05, 0.01 ppm - i.e. at least two to define the linear slope and two to show the position of the horizontal section below the limit of detection, where the electrode is unresponsive to concentration change. The limit of detection is then defined by the crossing point of the two straight lines drawn through these points. |
