Beginners Guide to ISE Measurement: Chapter 13.
RECENT DEVELOPMENTS
a) Meterless Electrode-Computer Interfaces
The recent development of computer interfaces for connecting the sensor electrodes directly to a personal computer, without the need for a meter to measure the voltage, has revolutionised ISE data acquisition and processing. The earliest versions of this type of measuring system were designed in the form of a flimsy PCMCIA card which were specifically for use only with a lap-top or palm-top computer and with only one particular style of electrode with special connecting cables.
 Later models are far more versatile and built in the form of a rugged electronic box connected to the computer and to the electrodes by standard cables and connectors. They can be used with any type of electrode plugged into the interface in the same way as for any conventional ion/pH meter. The electrode signals are processed by a low-noise amplifier and analogue-to-digital converter for direct transfer into any desk-top or lap-top computer. The user-friendly software will run on any computer using Windows operating system and is designed for maximum efficiency and versatility. Apart from the ease and speed of operation, the great advantage of this type of measuring system is that it virtually eliminates any possibility of operator error in recording and transfering data. It also facilitates far more sophisticated data processing, and display and archiving of results, once the raw data are securely recorded in the computer.
b) Data Processing Software
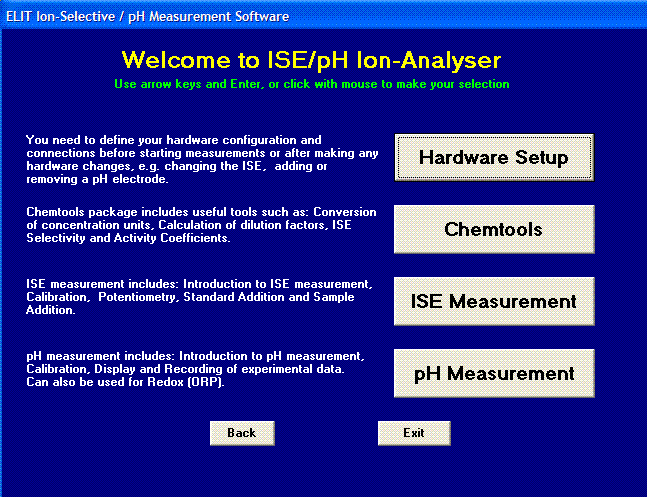
Data processing software is now available to carry out most of the functions previously done by the operator, and much more. The software basically carries out six main functions:
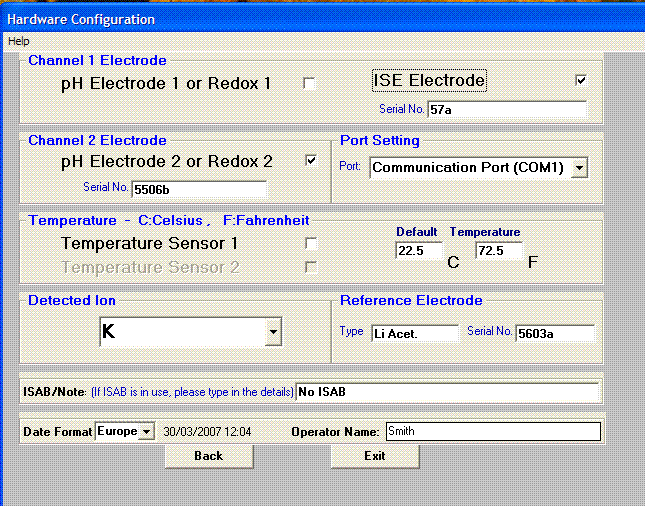
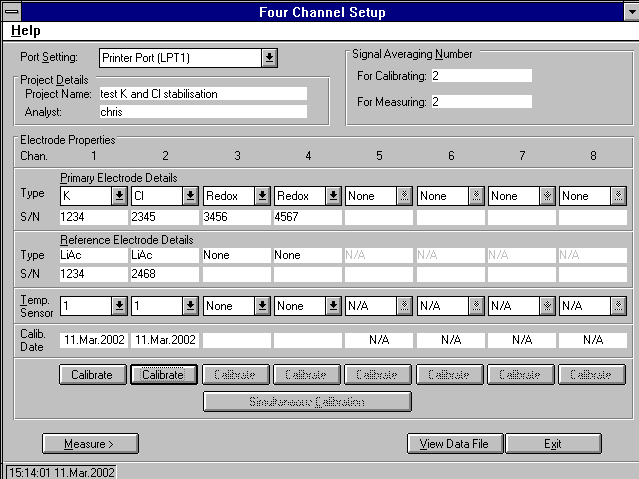
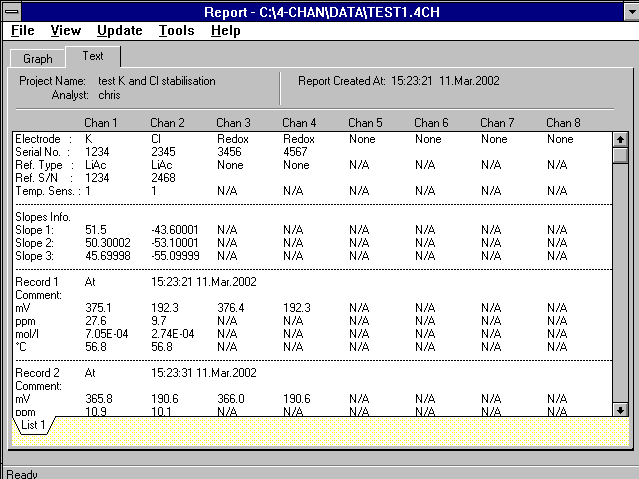
1) Hardware Set-up: to configure the system for whichever sensors and reference electrodes are being used (e.g. temperature, pH, Redox, or any ISE) and give a full documentation of electrode types, serial numbers, operator details, date and time etc.
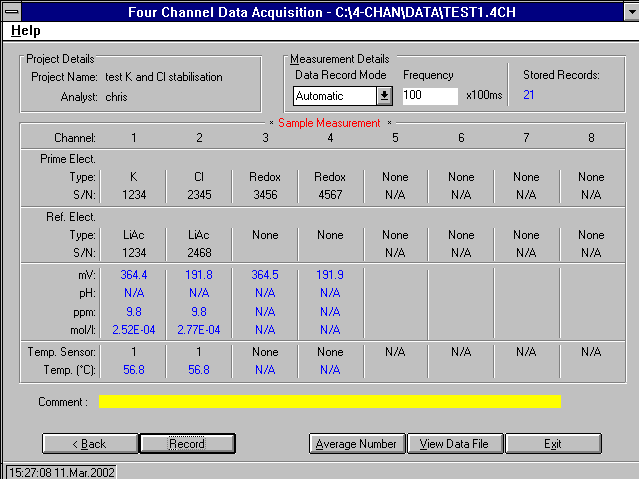
2) Signal measurement: The software interprets the signal from the interface and uses a calibrating factor to produce an accurate display of the millivolts. The operator can select to take single readings, taking about one second each, or the average of multiple readings. He can also specify a time delay after immersion of the electrodes, before taking a reading, if required.
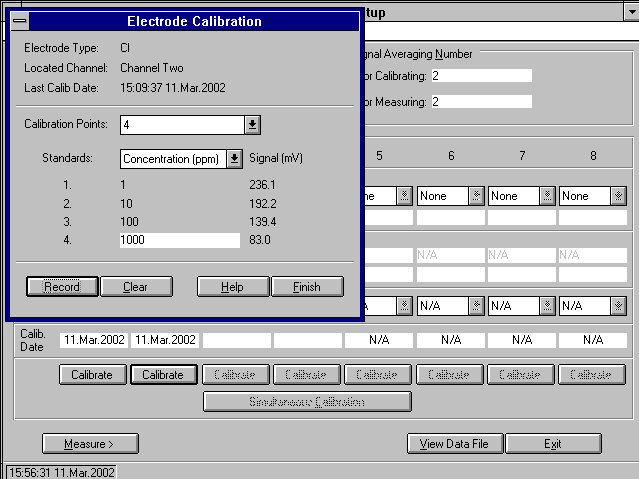
3) Calibration: the only operator entry required is of the concentration (or pH) of the calibration standards. For ISE measurements, calibration graphs are plotted automatically and instantaneously and can be assessed with various line-fitting techniques.
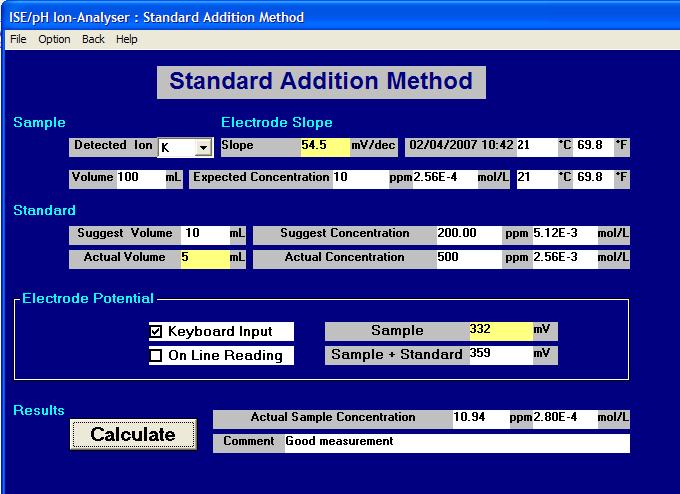
4) Sample calculation: the sample results are calculated instantaneously with no possibility of operator error. All results are saved and displayed in data tables where sample numbers and comments can be added. Sample results can be calculated using partial slopes if the calibration in the range required is not completely linear. Concentration results can be reported as ppm or moles/l. Samples can be measured using direct potentiometry or by Sample Addition and Standard Addition methods.
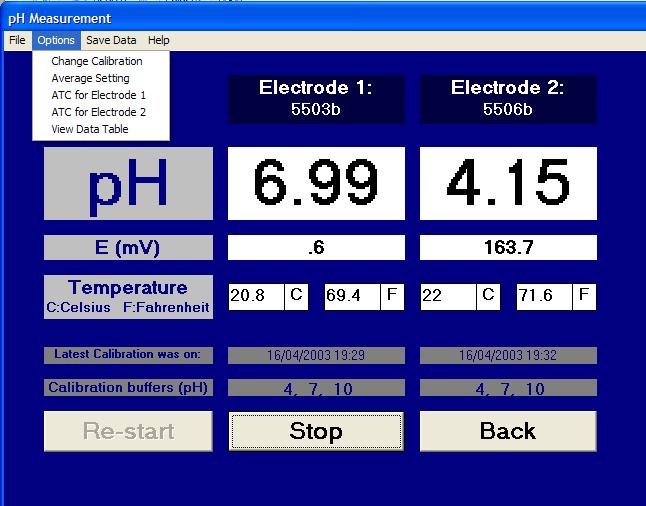
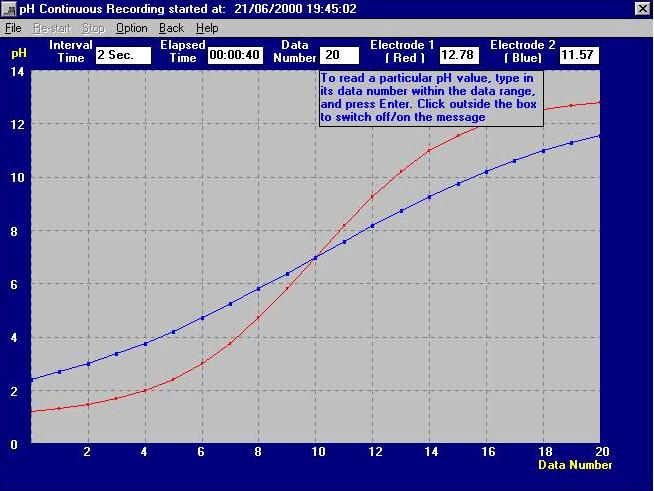
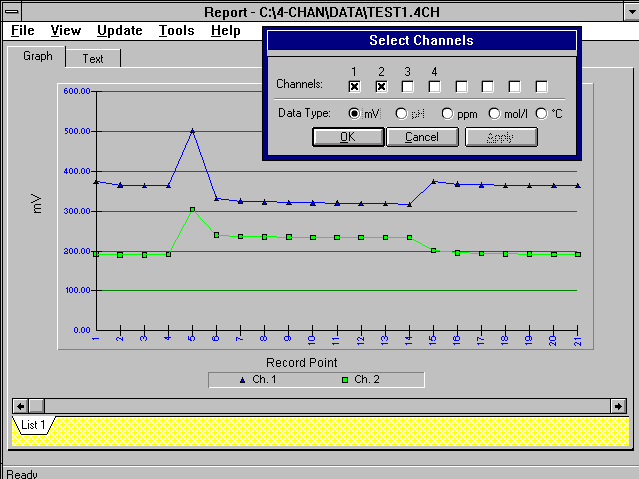
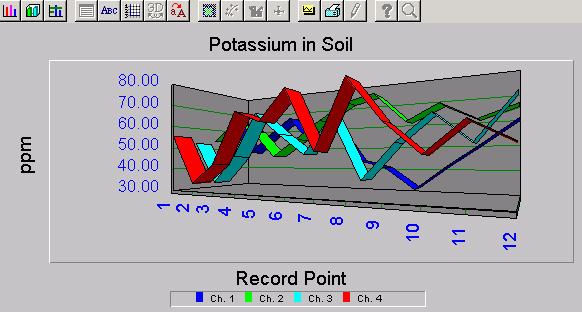
5) Display, reporting and archiving of results: all data can be stored, printed or imported to other software packages. Continuous recording of pH measurements can be displayed graphically, in real-time, to facilitate such activities as pH titrations or process monitoring.
6) Help and Advice for the Operator: the software contains several help menus and drop-down hints and warnings which guide the operator reliably through the analysis. It also includes an off-line ‘Chemtools’ package which permits the simple calculation of various electrochemical parameters and provides information on interference factors and activity coefficients. Since the computer interfaces and software were designed to improve on existing ion meters, the initial concept was based on the most up-to-date ion meters available. These generally have two inputs, one for pH and one for ISE measurements. They contain microprocessors for making pH and ISE calibrations and reporting the results as millivolts, pH, or concentration. Some of these meters also include a temperature sensor. Thus the initial design for the interface was with two channels which could perform all of these functions, but better.
