|
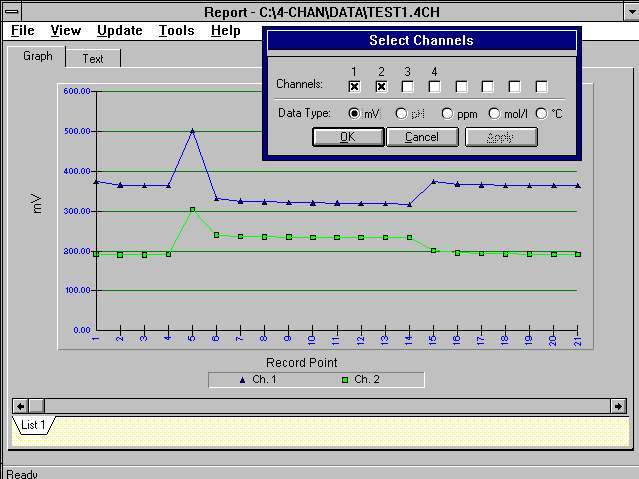
Results Graph for 4 or 8 Channel Analyser. The graph shows the results of an experiment to demonstrate the stabilisation time of a K (blue) and a Cl (green) electrode (held in a triple electrode head with a common lithium acetate reference electrode) when transferred from a 10 ppm solution of K (as KCl) to 1 ppm and back again. mV readings were recorded automatically at 10 second intervals. The electrodes were dabbed dry with a paper towel between solutions - causing the "spike" at point 5. |
